Applying for: The analyst, HUD, Dr. Who
Our stash of seven sensors sends its data more than once per second to Elasticsearch in Elastic Cloud. The amount of data is growing quickly, just in a few hours we have more than 25,000 data points.
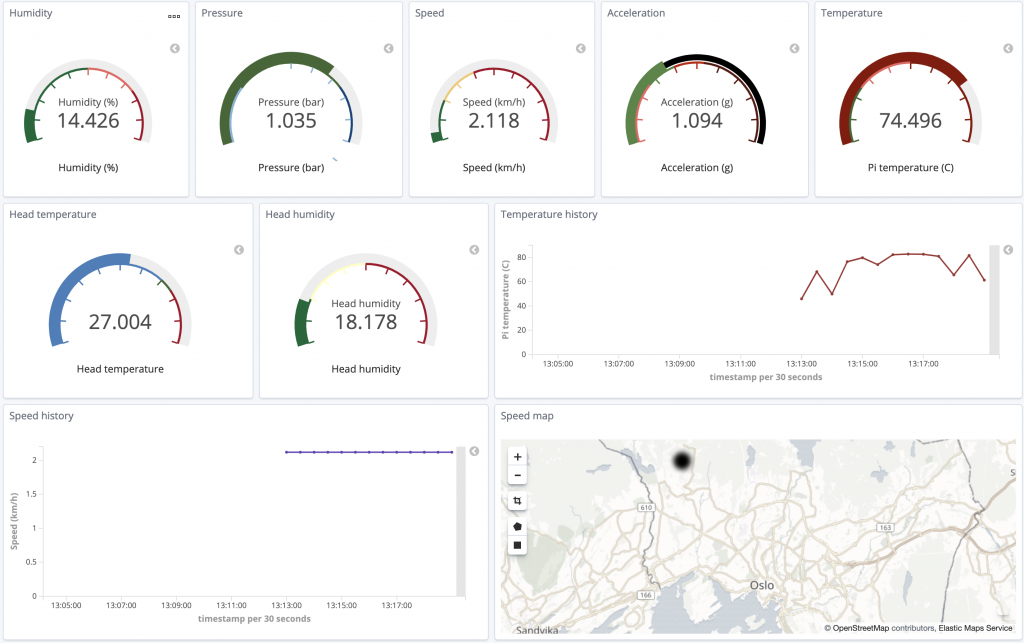
This data is displayed in the nice Kibana dashboard shown above. Here the SmartHelm user can see the humidity, pressure, speed and acceleration, and easily see if these are within the safe limits. Maybe the cycling trip was a bit rough? A bit too fast? This is easy to see in this dashboard. And if an accident happens, you can easily see it in the accelerometer data and judge the speed at the incident time.
With the temperature gauge the wearer can see the equipment’s health, as it shows the temperature very close to the Raspberry Pi. We have observed temperatures above 100 C at high loads, which is not ideal. The use can see this and increase his or her speed for increased air cooling of the Pi.
And the map enables the user to see the day’s (and previous days) biking route(s). As if that was not enough, we can use machine learning to detect anomalies in the data automatically. That way we can tell the SmartHjelm wearer where he or she biked a bit dangerously.
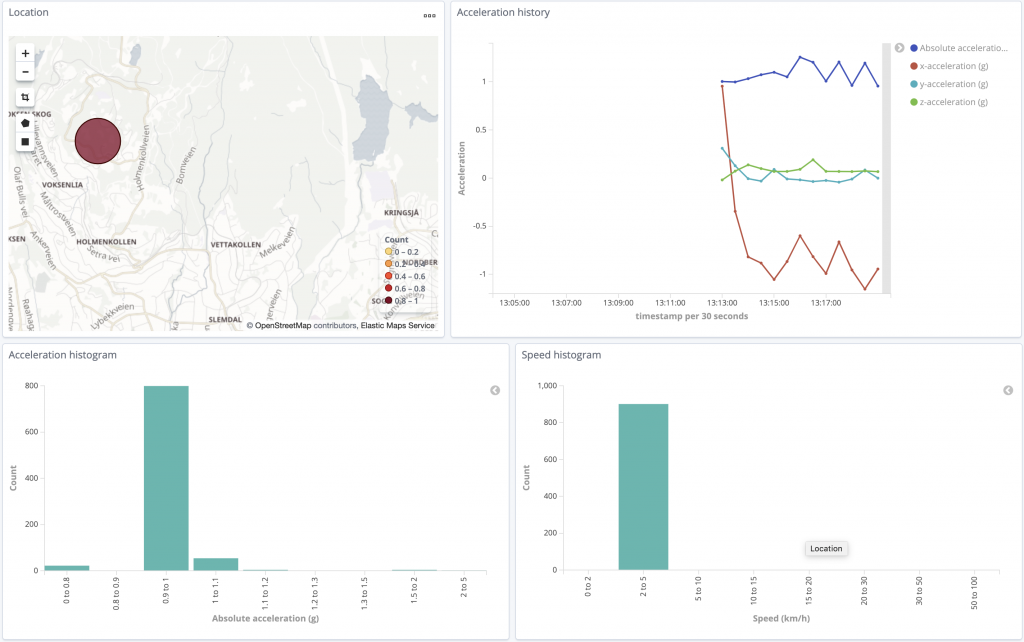
From our data we can also produce some nice statistics, like histograms of speed and acceleration. But, not only that, we can do machine learning!
As shown above, we log the body temperature and humidity, that is very close to the forehead of the person wearing the SmartHjelm. Doing time series analysis we can find anomalies in, for example, the humidity as shown below. Unfortunately we have not collected enough real data yet, but we use some fake data we have generated below. Anomalies are shown with dots, the more red the colour the more sever the anomaly.
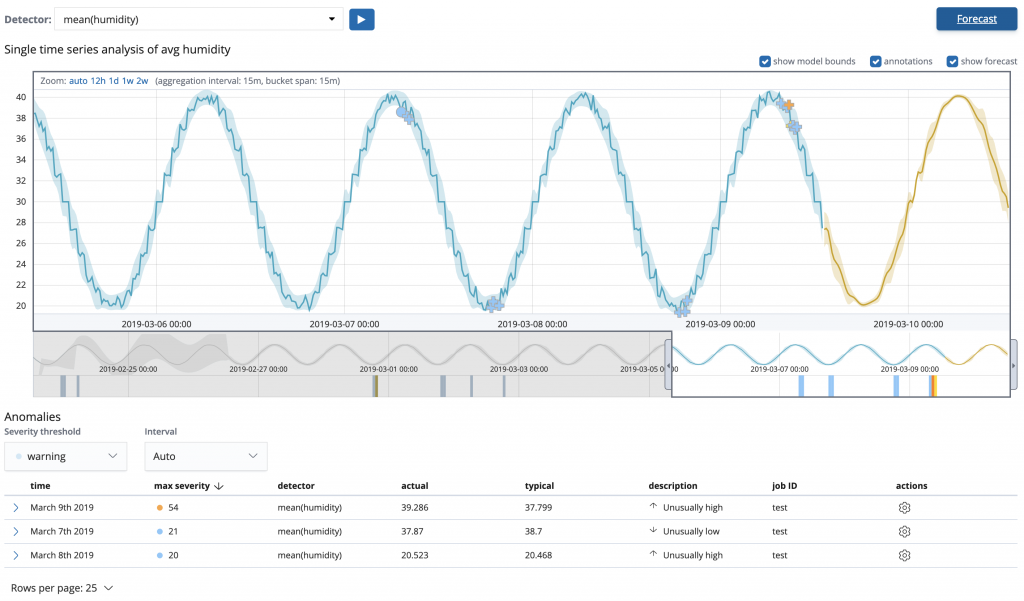
Not only can we find the anomalies, but we can do forecasting to predict how the humidity close to the body, a proxy for perspiration, will evolve with time. Above we show our prediction one day ahead.
Not only will our SmartHjelm gather useful information for a nice dashboard, but also provide useful health benefits by providing back to the user at which points you sweated abnormally, and how you will sweat in the future, so that you can take action (perhaps bring a towel?).
Another health benefit of SmartHelm is, of course, the body temperature sensor. Through machine learning it finds anomalies in body temperature, and can even predict future body temperatures, so that you can take preventive measures to avoid your body becoming too hot.